Platform

Report

Prove risk is going down with reporting you can talk to

Cogent tracks remediation to verified closure, generates executive reporting in natural language, and proves outcomes with evidence auditors can trust.

Book a demo

Book a demo

Cogent Platform Screen - Report

Most tools take months to roll out and even longer to show value. Cogent was different. We saw real results right away. Its the fastest Ive gone from zero to actual risk reduction.

Mo Balakrishnan

CISO, University of the Pacific

Most tools take months to roll out and even longer to show value. Cogent was different. We saw real results right away. Its the fastest Ive gone from zero to actual risk reduction.

Mo Balakrishnan

CISO, University of the Pacific

Most tools take months to roll out and even longer to show value. Cogent was different. We saw real results right away. Its the fastest Ive gone from zero to actual risk reduction.

Mo Balakrishnan

CISO, University of the Pacific

Post-Deployment Verification

100%

4 0f 4 completed

auth-service

Production • 18 instances

No vulnerability found

api-gateway

Production • 20 instances

No vulnerability found

web-app

Production • 11 instances

No vulnerability found

web-app

Staging • 1 instance

No vulnerability found

Can you generate a report showing which environment have the most business critical assets with vulnerabilities?

Sure! Here is a line graph of vulnerabilities broken down by environment

Can we actually use a bar chart and show the vulnerabilities broken out by CVSS severity?

Total Vulnerability By Environment

6 MONTHS

STAGING

DEV

PROD

DEMO

Of course! Here’s a bar chart.

1

All Teams

2

Engineering

3

IT & Infra

4

Security

SLA Performance

84%

Within SLA

SEP

OCT

NOV

DEC

JAN

FEB

Agent Insight

SLA compliance is improving as automated patching cut cloud misconfigurations and known CVEs by 38%, while most remaining vulnerabilities are on legacy assets.

Post-Deployment Verification

100%

4 0f 4 completed

auth-service

Production • 18 instances

No vulnerability found

api-gateway

Production • 20 instances

No vulnerability found

web-app

Production • 11 instances

No vulnerability found

web-app

Staging • 1 instance

No vulnerability found

Can you generate a report showing which environment have the most business critical assets with vulnerabilities?

Sure! Here is a line graph of vulnerabilities broken down by environment

Can we actually use a bar chart and show the vulnerabilities broken out by CVSS severity?

Total Vulnerability By Environment

6 MONTHS

STAGING

DEV

PROD

DEMO

Of course! Here’s a bar chart.

1

All Teams

2

Engineering

3

IT & Infra

4

Security

SLA Performance

84%

Within SLA

SEP

OCT

NOV

DEC

JAN

FEB

Agent Insight

SLA compliance is improving as automated patching cut cloud misconfigurations and known CVEs by 38%, while most remaining vulnerabilities are on legacy assets.

Post-Deployment Verification

100%

4 0f 4 completed

auth-service

Production • 18 instances

No vulnerability found

api-gateway

Production • 20 instances

No vulnerability found

web-app

Production • 11 instances

No vulnerability found

web-app

Staging • 1 instance

No vulnerability found

VNeVr@i0fTi9c4aZt&i@oAnL

VBe4rOiOfAi8c6aRtDiMoTnW

VEeQrLiLf4iWc3a6tUiQoWn@

Verifies remediation actually happened

"Ticket marked closed" doesn't mean the vulnerability is gone. Cogent validates fixes and attaches proof so you can show auditors what actually changed.

Remediation validation

After engineering closes a ticket, Cogent validates the vulnerability is no longer present to ensure accuracy and alignment.

Evidence automatically attached

Every closed vulnerability includes auditable, timestamped proof that can be retrieved in the future.

Exception and risk acceptance tracking

When remediation isn't feasible, track documented risk acceptances with full context: who approved, why, what compensating controls are in place, and when it expires. 

Can you generate a report showing which environment have the most business critical assets with vulnerabilities?

Sure! Here is a line graph of vulnerabilities broken down by environment

Can we actually use a bar chart and show the vulnerabilities broken out by CVSS severity?

Total Vulnerability By Environment

6 MONTHS

STAGING

DEV

PROD

DEMO

Of course! Here’s a bar chart.

iTnKsRiVgBhWtEsV

iZnVsYiNgYh1tBs5

iJnGsBi2gAh7t@sK

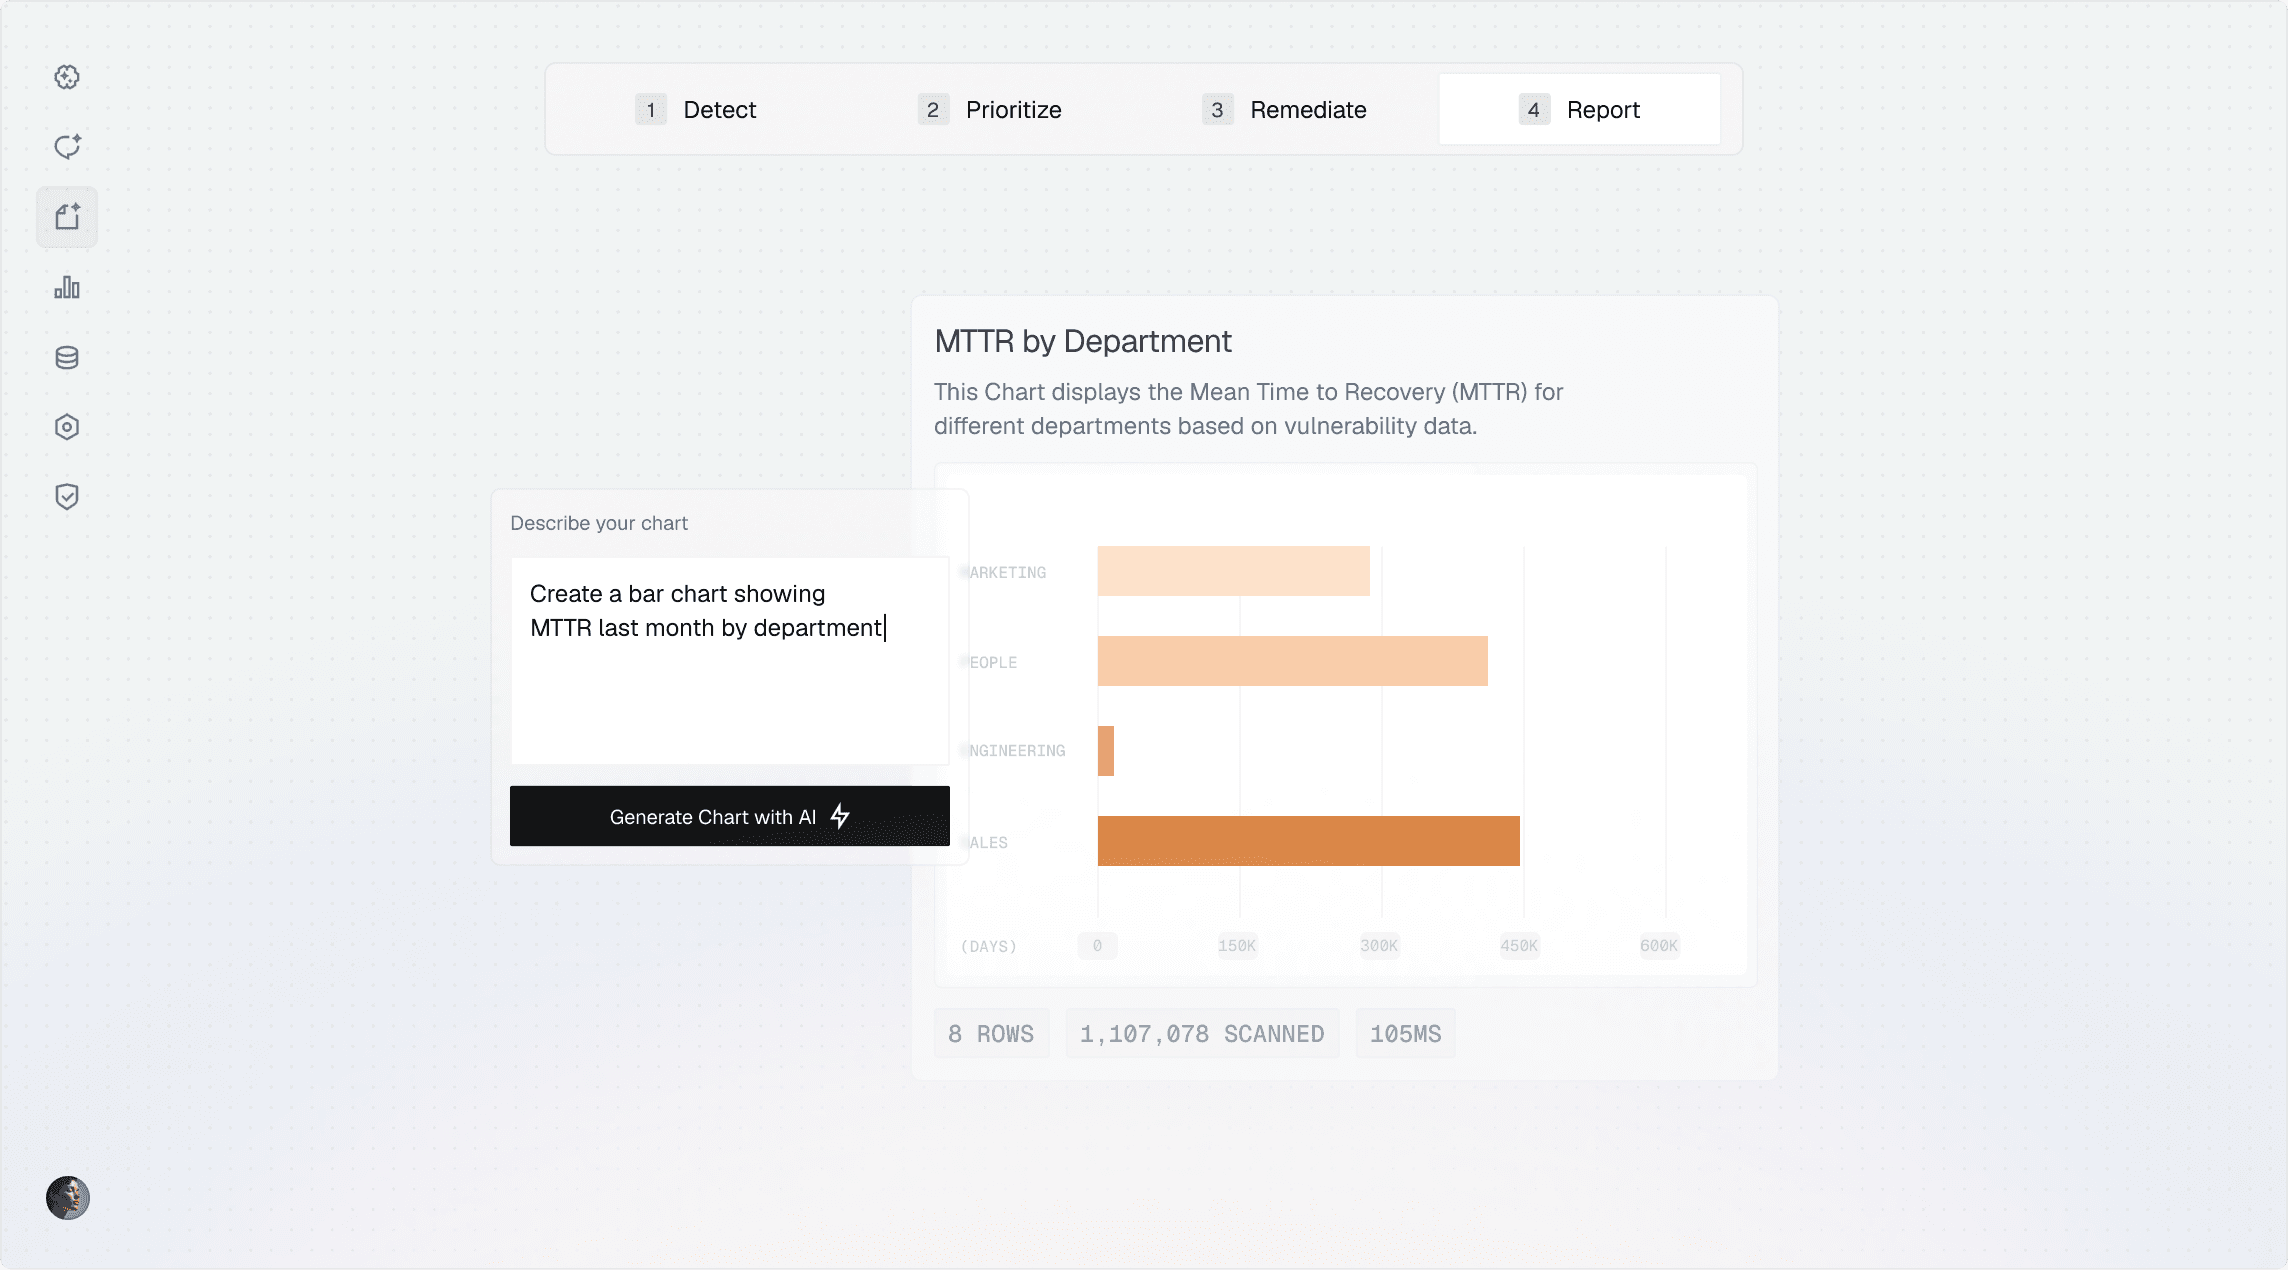
Generate reports through natural language

Stop exporting to Excel and building BI dashboards manually. Ask Cogent what you need to know in plain English and get executive-ready answers in seconds.

AI-native charting

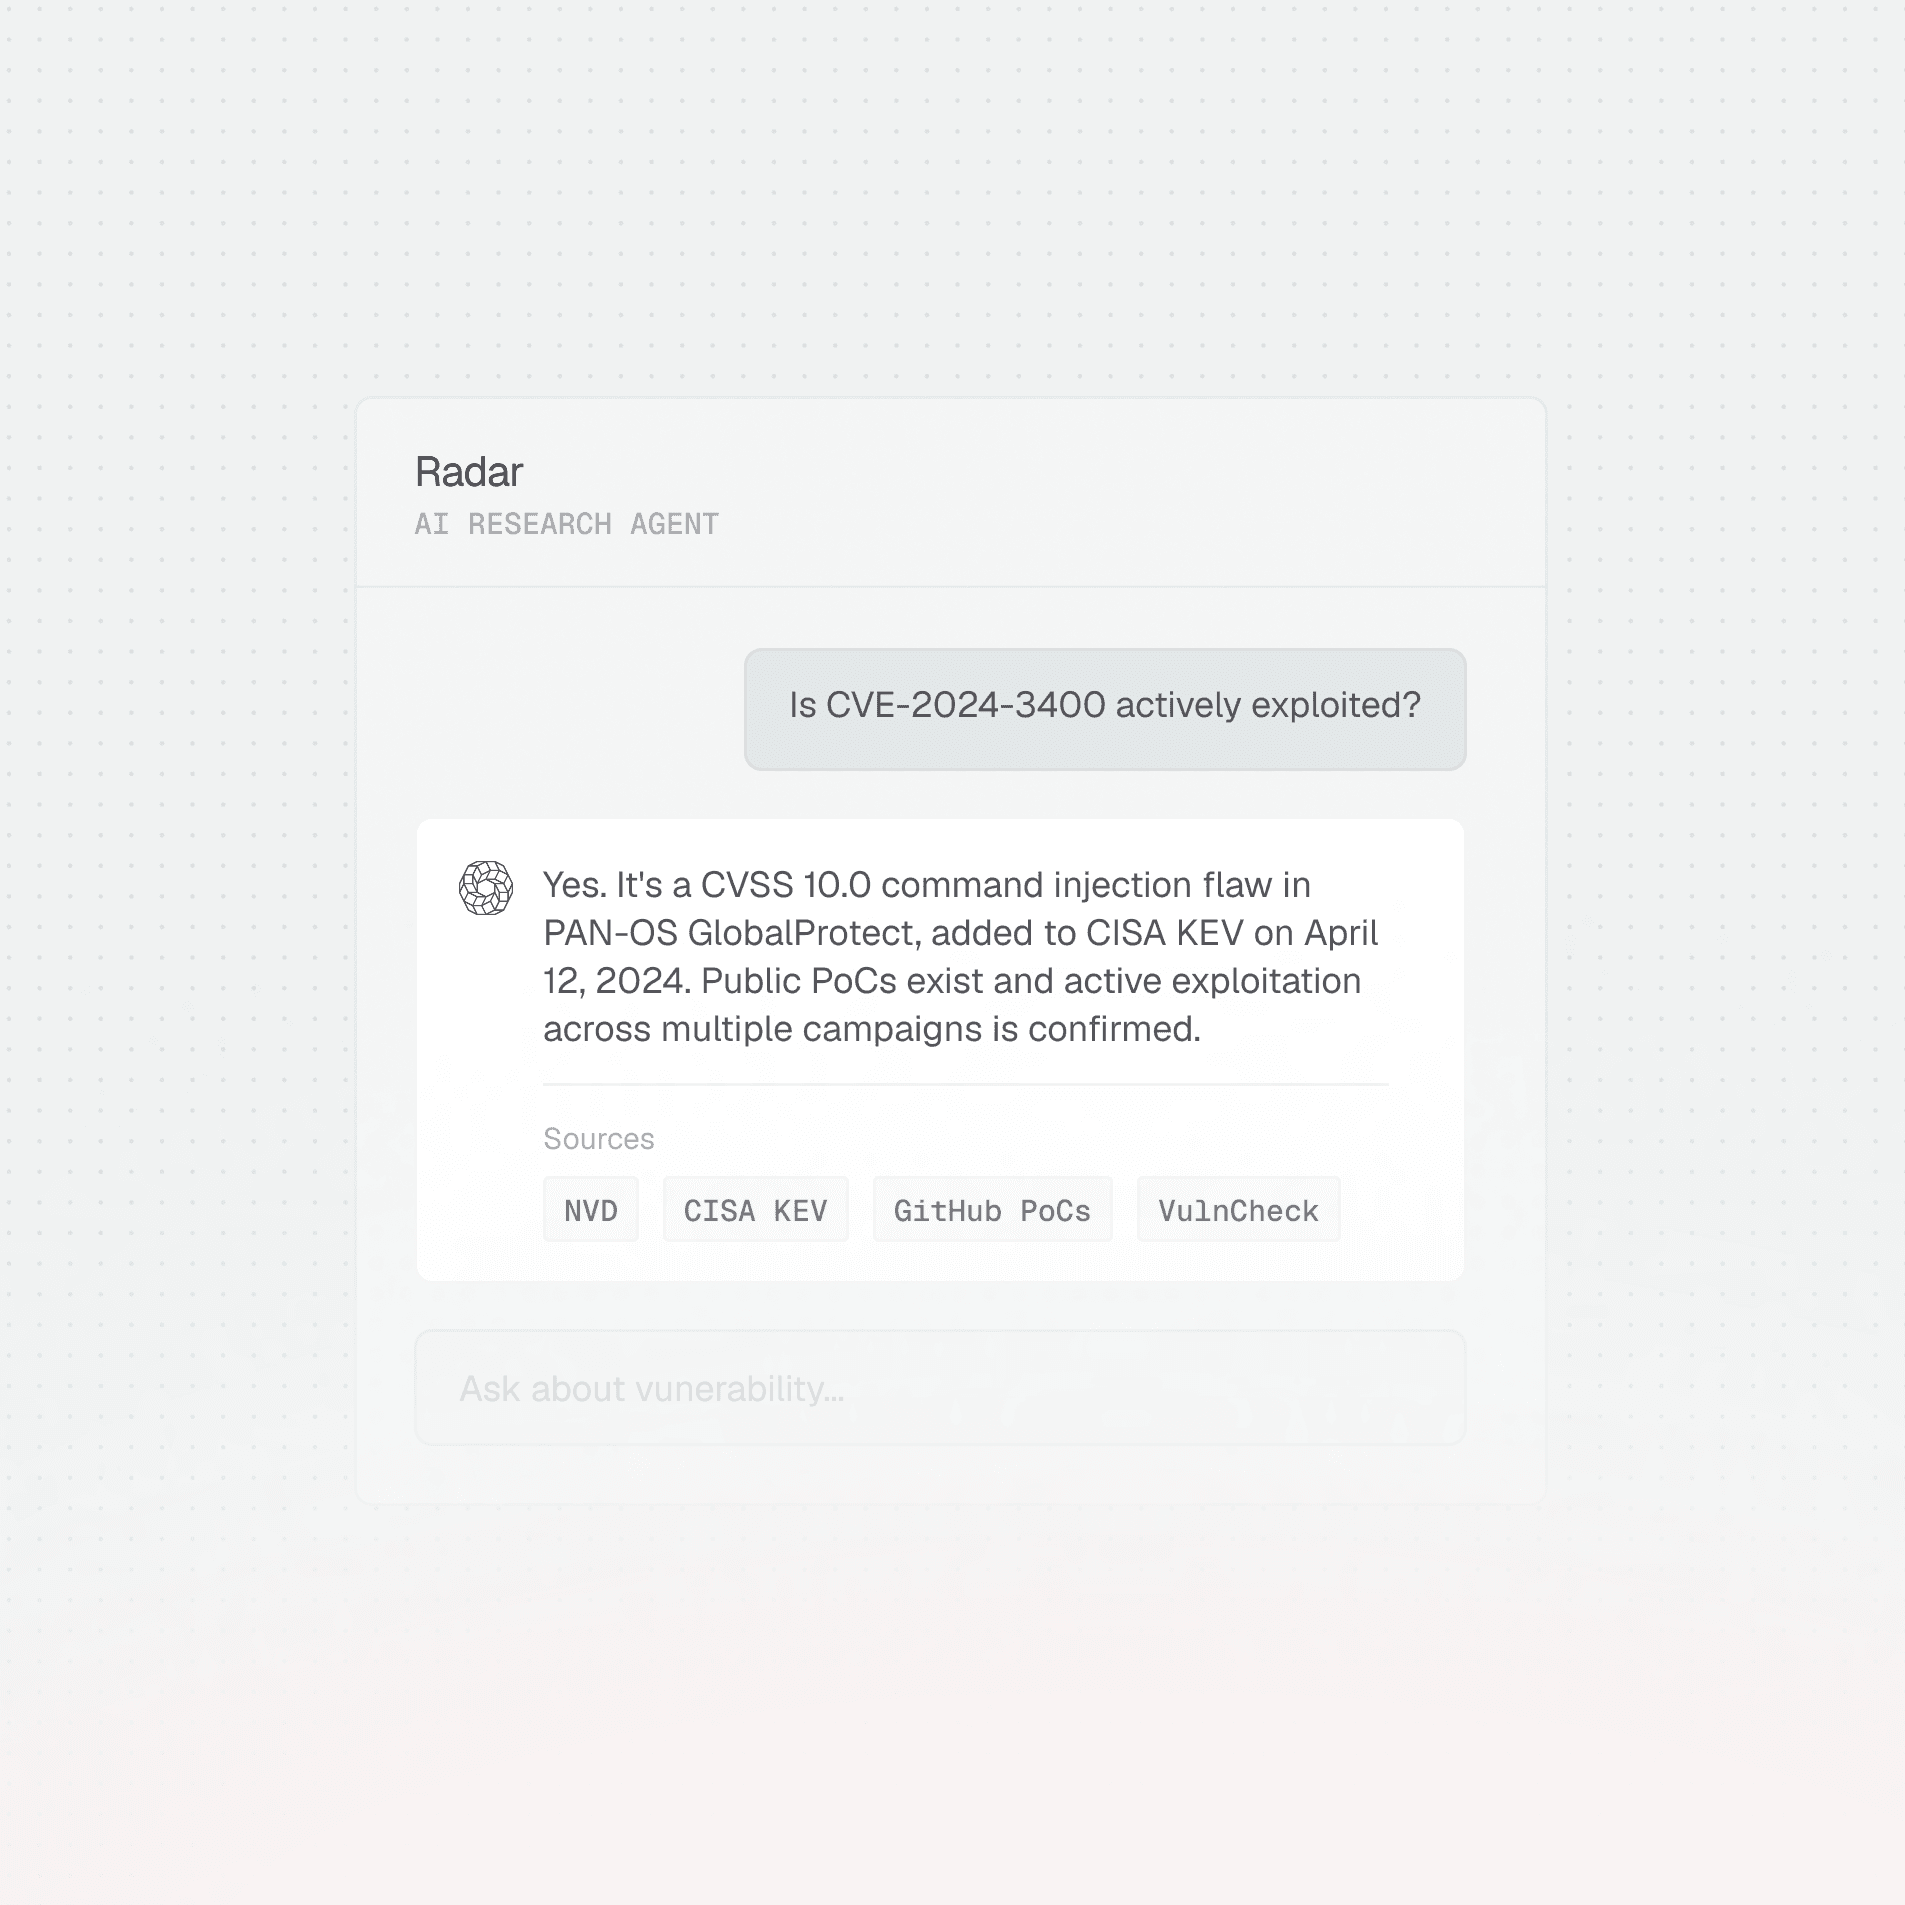
Ask questions in plain English: "Show me critical vulnerabilities by business unit over the last quarter." Cogent generates charts you can review on demand or download for presentations.

Deep research reports

Need to explain why certain vulnerabilities exceeded SLA or justify mitigation decisions? Cogent generates long-form, evidence-backed reports that show the work and reasoning that are ready for audits or board reviews.

Executive slides with talk tracks

Automatically generate board-ready presentations with narrative summaries. Cogent creates the slides and the story so you're not scrambling before leadership meetings.

1

All Teams

2

Engineering

3

IT & Infra

4

Security

SLA Performance

84%

Within SLA

SEP

OCT

NOV

DEC

JAN

FEB

Agent Insight

SLA compliance is improving as automated patching cut cloud misconfigurations and known CVEs by 38%, while most remaining vulnerabilities are on legacy assets.

A2n3a4l%y4tHiRc6sJ

AInPa3lUyVtTiHcOsH

A@n8aJl7y%tCiAc7sU

Tracks program performance over time

See how your vulnerability management program is performing: where you're meeting SLAs, where work is stalling, and whether risk is trending down.

SLA tracking across severity bands

Monitor compliance with remediation SLAs segmented by severity. See which bands are meeting targets and which are slipping, then drill into why.

Trend, aging, and MTTR analytics

Track mean time to remediation, backlog aging, and risk trends over time. Understand whether your program is improving and where bottlenecks occur.

Segmented views by team and source

Compare performance across teams, business units, or asset types. Identify which teams are closing vulnerabilities faster and which need support.

B9o4o$kG  aI  dVeTm4oA

See Cogent In Action

Schedule a personalized demo today to learn how Cogent can supercharge your vulnerability management program.

Book a demo

Book a demo

Free risk assessment

Free risk assessment

B9oGoRk@  aC  d5e8m4oS

See Cogent In Action

Schedule a personalized demo today to learn how Cogent can supercharge your vulnerability management program.

Book a demo

Book a demo

Free risk assessment

Free risk assessment

B$oYoVk2  aO  d%eRm7oP

See Cogent In Action

Schedule a personalized demo today to learn how Cogent can supercharge your vulnerability management program.

Book a demo

Book a demo

Free risk assessment

Free risk assessment