Blog
Engineering
From Findings to Fixes: Building Cogent’s Security Knowledge Graph
At enterprise scale, security findings only become actionable when connected to the environment they affect. Cogent’s knowledge graph gives agents the context to turn that volume into coordinated remediation, with the evidence needed to explain decisions and verify results.
6 min read


Effective vulnerability management and remediation require a connected understanding of a customer’s security environment. The context needed for those decisions is often spread across scanners, registries, and other organizational records. Missing connections can leave necessary work unidentified, misdirect remediation efforts, and prevent teams and agents from achieving and verifying risk reduction.
At enterprise scale, hundreds of millions of exposures can compete for attention. Even accurate findings can create noise when repeated observations and related issues appear as separate tasks. Identifying which findings belong together requires a deep understanding of their shared causes and potential fixes. Deciding which work should come first depends on its significance in the customer’s environment. Agents need a model they can query to make those decisions; reconstructing that context within each session does not scale at this level.
We built Cogent’s knowledge graph to provide a durable, extensible model of each customer’s security environment. With that foundation, agents can turn individual findings into coordinated changes across the environment, backed by the evidence needed to establish whether those changes reduced risk.
Modeling the context around a finding
A scanner reports CVE-2021-44228, commonly known as Log4Shell, in log4j-core 2.14.1 inside a container image called document-worker. Log4Shell allows an attacker to execute code through malicious input that a vulnerable application logs. Deployment records also show that the image runs in three workloads, including a production workload that processes invoices. Organizational records identify the Billing team as the owner. Before any remediation can begin, our system needs to connect these sources so we can answer questions like:
Which specific deployments need attention?
What steps need to be taken to triage and remediate safely?
Where is attention needed urgently?
Who needs to take action?
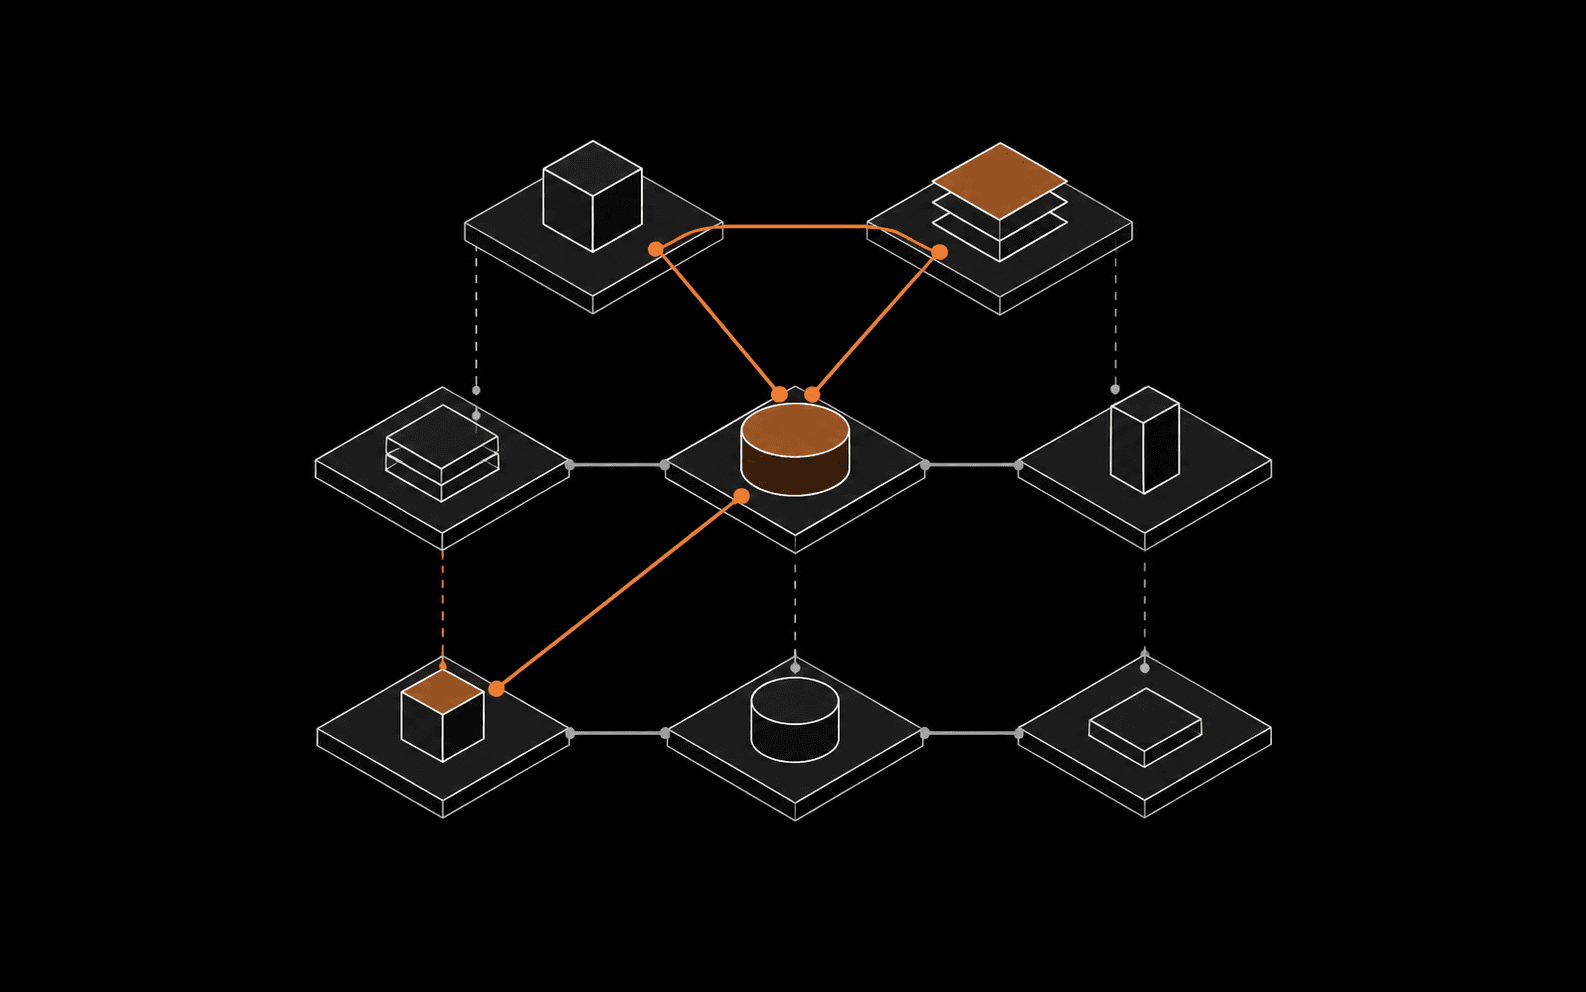
We represent this environment as a property graph where entities form the nodes, relationships form the edges, and both can carry attributes. Entities represent distinct objects or key concepts in the customer’s security environment. In this example, the image and its running workloads are resource entities, the Log4Shell finding is an exposure, the affected package is software, and Billing is an identity. These are some of the entity types the model uses to connect security findings to their wider context.
Typed relationships give agents paths to follow through the customer’s environment: the Log4Shell finding connects to document-worker, the image connects to its three running workloads, and the production workload connects to its owner, Billing.
Attributes describe individual entities, such as a resource’s environment or business criticality. Some attributes apply across resource kinds; others are specific to images, virtual machines, or other kinds. An image, for example, also has a registry, repository, and digest. We keep common fields in a shared resource definition and place specialized fields in facets: typed extensions stored in separate tables. This polymorphism allows agents and products to query resources together using their common fields, then access a facet for details specific to a resource kind.
Building this model requires reconciling observations from different sources without losing distinctions that matter to remediation. The scanner’s image record and deployment references must resolve to the same image identity, while its running workloads remain distinct. Enriching those observations with facts like ownership data and business context paints a more complete picture; agents need this to investigate reliably, scope remediation, and verify the results. Our ingestion framework, which uses Temporal to coordinate a series of Spark jobs, retains the supporting evidence so agents can also inspect the basis for the model’s values and connections. That picture must also stay current as deployments, findings, and organizational context continually change.
The resulting graph is a distilled view of source observations that gives clustering, prioritization, agent investigations, and product views the same connected context to use. Agents can query this representation without repeatedly reconciling identities or interpreting vendor-specific schemas. For document-worker, this context lets an agent organize related findings around a shared software change while preserving the distinct workloads that need the replacement. Production and business context help establish the rollout priority, while ownership identifies who must act.
Making the graph usable by agents
Discovering and querying the graph
To investigate the impact of Log4Shell in document-worker, an agent needs to know which fields identify the image, how it connects to runtime resources, and what attributes such as environment mean. Our ontology defines the model’s entity types, attributes, and relationships through a versioned contract shared by ingestion, storage, serving, and agent tools. It connects the meaning of the data to its representation across the platform, giving agents the context layer needed to interpret records and understand how they relate.
Then, agent tools expose that context alongside read-only SQL access to customer records. The ontology also determines which schemas each tool exposes, scoping what an agent can discover and query through that tool.
Tracing results back to evidence
For document-worker, an agent can discover how images connect to runtime resources, then query the affected workloads, their environments, and their owners. The query identifies Billing’s invoice-processing workload as production, which can influence decisions like remediation priority or risk assessment. But suppose the scanner tags that workload as “development,” while the organizational inventory classifies it as “production.” Rules can be applied to reconcile these competing values, but understanding that result requires preserving the disagreement and the basis for the selection.
Provenance is a core primitive of our graph. Source observations and resolution evidence are included in the model by default. We track which sources contributed data, the candidate values they supplied, and the chain of evaluated rules—including each rule’s outcome. This allows us to trace a resolved result back to the evidence and logic behind it.
In this example, the customer’s policy gives the inventory’s classification precedence. The selected environment value is production, while both source values remain available for inspection. An agent can explain the classification using the inventory record and selection rule, while surfacing the conflicting scanner observation. Building provenance into the graph gives agents and products a shared basis for explaining these decisions.

Adapting the model to customer context
The shared model supports reusable components across products, but the model needs to grow as new sources introduce additional context and customers’ environments change. As their systems and priorities change, the ontology must evolve with that context to effectively serve these requirements. Tenant overlays extend the shared ontology with customer-specific definitions and metadata, giving agents and products a common environment model that reflect each customer’s systems, organizational structure, and priorities.
For example, a new customer source might associate Billing’s invoice-processing workload with a cost center. A tenant overlay defines that field, and ingestion links the supplied values to the existing workload resources. Agents and products can then use cost center alongside shared attributes such as environment to group and scope remediation work.

Serving the graph at terabyte-scale
An enterprise environment can contain hundreds of millions of security findings, alongside the resources and context needed to investigate them. Investigating the Log4Shell finding means locating the affected document-worker workloads within that data and connecting them to the context needed to prioritize and coordinate remediation. At this scale, we need a queryable model that supports both background analysis and responsive product views.
Our earlier Knowledge Base assembled related data in PostgreSQL on each request, then filtered, sorted, and counted the results. As datasets grew, that repeated work produced expensive and uneven query times. PostgreSQL remains effective for transactional data, but we needed a different approach to serving analytical reads across the expanding environment model.
Storing the authoritative graph
We store the graph's entities, typed relationships, and provenance as Apache Iceberg tables on S3. Iceberg's open format lets multiple processing and query engines use the same stored data. Schema evolution accommodates changes to the ontology, snapshot isolation gives readers a consistent committed version of a table, and time travel supports inspection of earlier retained snapshots.
Background agents with less stringent latency requirements may query the authoritative graph directly through a query engine, retrieving relevant entities, relationships, and provenance as an investigation progresses. Other consumers can build views from the same resolved identities and classifications. Those views can be optimized or rebuilt without independently resolving the source data.
Serving interactive queries
We evaluated querying Iceberg directly through engines such as Trino and ClickHouse. Direct access avoids a separate serving copy and its refresh pipeline, but performance depends on the amount of data scanned and concurrent query demand. For the Knowledge Base, we chose to load derived datasets into ClickHouse, where we could organize the data around performant repeated filtering, sorting, and aggregation.
Projections let us prepare those different shapes from the same graph. A serving projection can pre-join the Log4Shell finding and affected document-worker image with image-to-runtime relationships and ownership data. The inventory can then filter affected workloads to production or group them by owner without repeating those joins on every request. Products reuse the model's resolved identities and values while optimizing their own reads.
Precomputing these views moves work out of repeated requests, at the cost of additional storage and refresh computation. We manage that complexity by reusing projections where possible and designing them around known query patterns. The authoritative graph remains the shared source of truth, while derived views provide layouts suited to interactive reads.

From investigation to verified remediation
The investigation can now produce a proposal with an explicit scope: update the affected Log4j dependency, rebuild document-worker, and coordinate deployment of the replacement to the three affected deployments. The model connects that shared software change to the resources and teams responsible for carrying it out.
Suppose Billing deploys the replacement to the production workload first, while the other two workloads still use the vulnerable image. Tracking the image separately from its runtime instances lets the investigation distinguish a completed build from a completed rollout. An agent could use fresh deployment and scan evidence to assess whether the production workload’s finding is resolved, identify the remaining scope, and direct follow-up to the appropriate owners. Once that evidence is ingested and projections refreshed, the analyst’s inventory can reflect the same progress.
This is the agent workflow we are building toward. Effective remediation requires enough connected context to identify shared fixes, prioritize the work, and establish where changes still need to happen. Provenance makes the basis for those decisions inspectable, while updated observations provide evidence for verifying the results. Cogent’s knowledge graph supplies that foundation, allowing new sources and customer-specific context to extend what agents and products can understand and act on.